发表SCI论文时,精准、详细地描述文中所用的统计学方法,可为审稿人留下严谨的印象。许多审稿专家返修意见中常常要求完善资料统计分析或追加部分统计数据,如何正确规范书写统计分析(Statistic analysis)呢?
以两篇影响因子>15分的SCI为例详细解答严谨的统计方法应如何描述。
(一)分析软件信息
首先应当包含所采用的分析软件信息,论文中一般采用IBM SPSS 18或19版本即可,但SPSS 22以上版本功能更强大,可自带简易版倾向性评分匹配功能,更高阶选手可以挑战使用SAS或者R语言,描述参考:
The data were … analysed by SPSS version 11.5 for Windows (SPSS Inc., Chicago, IL, USA). 1
(二)数据形式
常用Kolmogorov-Smirnov法进行正态检验,符合正态分布的计量资料采用均数±标准差(Mean ±SD)表示,不符合正态分布的计量资料采用中位数±四分位数间距(Median, IQR)表示,计数资料采用率表示,描述参考:
Continuous variables with normal distribution were presented as mean (standard deviation [SD]); non-normal variables were reported as median (interquartile range [IQR]). For normal variables, numbers and percentages are given.1
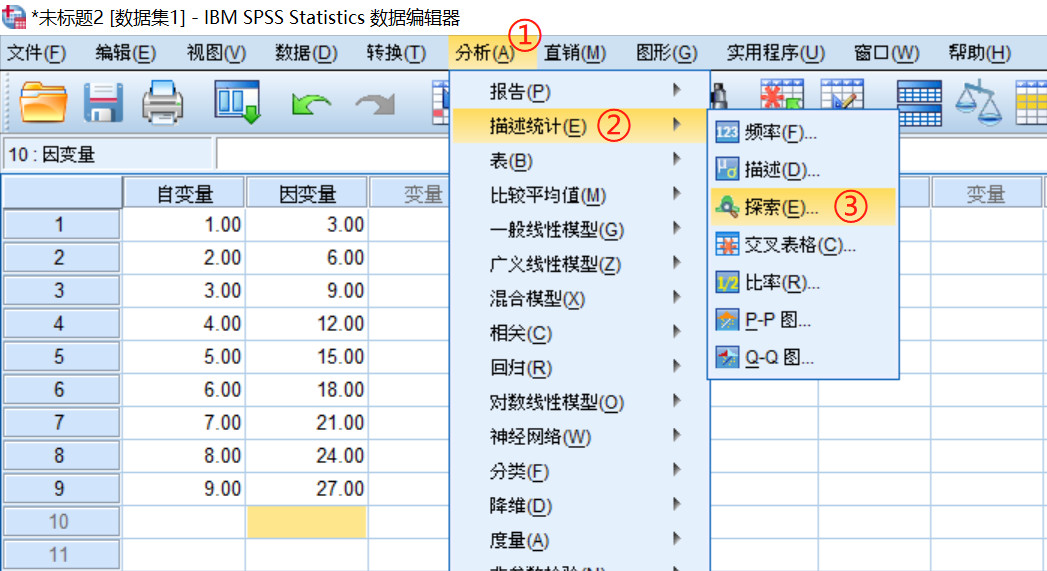
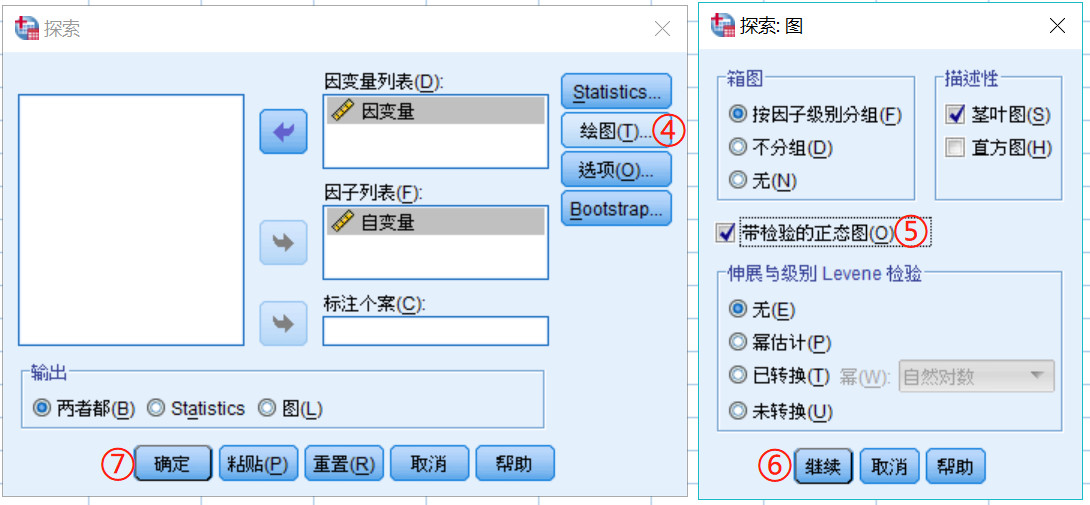
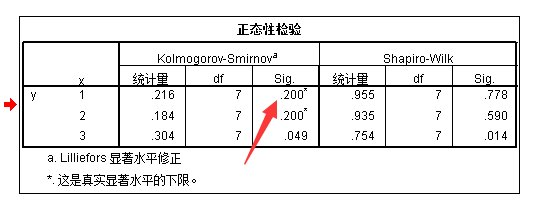
采用SPSS进行正态性检验操作如下,若P(Sig)大于0.05则数据满足正态分布:
(三)检验方法
服从正态分布的连续资料组间比较采用T检验,不服从正态分布的连续资料组间比较则考虑使用Kruskal-Wallis秩和检验或U检验,描述参考:
Means of 2 continuous normally distributed variables were compared by independent samples Student's T test. Mann-Whitney U test and Kruskal-Wallis test were used, respectively, to compare means of 2 and 3 or more groups of variables not normally distributed.1
两组样本率的比较采用卡方检验或fisher精确检验,描述参考:
To compare proportions of two nominal variables, Pearson’s χ2 test and Fisher’s exact test of independence were used.1
一般认为P小于0.05差异具有统计学意义,描述参考:
A value of P<0.05 was considered significant.1

图1. F值=0.01,P(Sig)>0.05说明两组数据方差齐,T检验结果为P=0.082
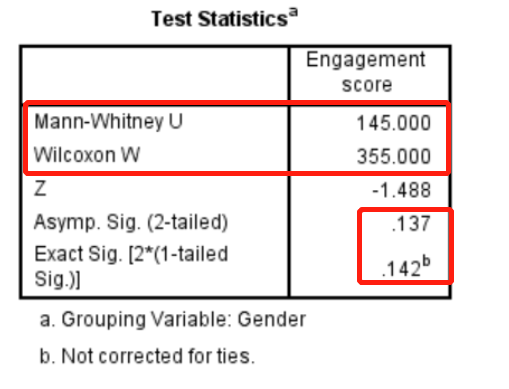
图2. U检验统计量值为145,Kruskal-Wallis秩和检验统计量值为355,Asymp.Sig代表渐进P值;Exact Sig代表精确P值。
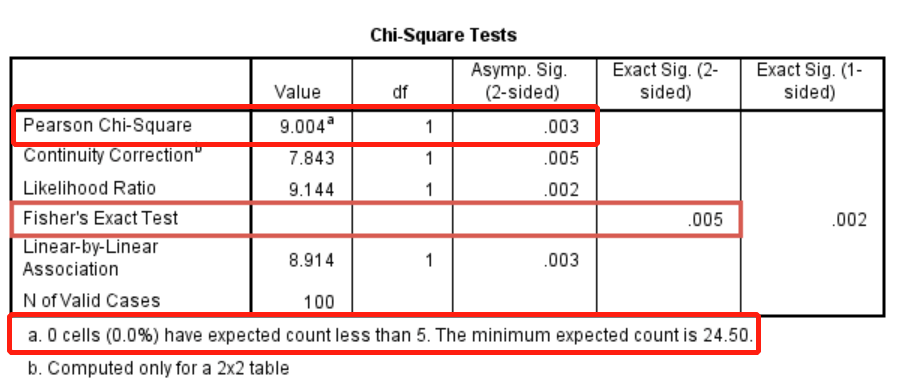
图3.所有单元格期望频数>5,χ2=9.004,P=0.003,若存在单元格期望频数<5,采用Fisher精确检验,P=0.005
(四)主要分析指标
对于诊断实验相关性文章,一般需要在文章中描述灵敏度、特异度、阳性预测值、阴性预测值及其95%CI、ROC曲线下面积及其95%CI、截断值等,描述参考:
Receiver Operator Characteristic curves (ROC) were constructed to determine and compare the sensitivity and specificity of different pepsin cut-off concentrations and their predictive value to diagnose or refute the diagnosis of....2
对于分析患者预后的文章,多采用Kapla-Meier进行生存分析,若只考虑一个分析因素,则采用Log Rank法或Breslow法比较两组患者生存曲线是否存在差异,若两组生存曲线不存在交叉,则提示满足PH假定,在校正多种混杂因素后,进一步采用Cox比例风险模型(Cox proportional hazard model)分析研究因素对于结局的影响,描述参考:
Event-free survival and overall survival were analysed in all randomised patients using the Kaplan-Meier method and compared with the log-rank test adjusted for the prognostic factors of age, disease stage. Event-free survival according to risk factors at baseline and before high-dose chemotherapy was assessed post hoc using a Cox model to assess interaction with busulfan and melphalan, or carboplatin, etoposide, and melphalan.3


